
Spectral Doppler: Left Atrial Appendage
Obtaining the spectral Doppler
- Identify the left atrial appendage (LAA) in the mid-esophageal views. The following two-dimensional TEE view can be used:
- To assess flow in the LAA, align the pulsed wave (PW) sample volume box within the area of maximum velocity, usually within the opening or middle 1/3 of the LAA. Avoid measuring within the distal 1/3 of LAA where artifacts from the pectinate muscles may arise (figure 1).
- To aid identification of maximum flow within the LAA, apply colour Doppler over the LAA using a low velocity scale.
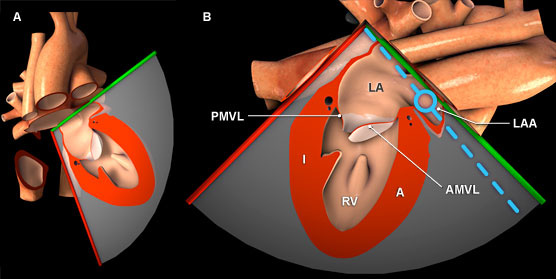
Figure 1: Three-dimensional heart model shown in cross-section to highlight the position of the TEE plane in the mid esophageal two chamber view. A) Anterior view of the heart with TEE plane. B) Anterolateral view of the heart and TEE plane. The blue dotted line represents the orientation of the pulsed wave cursor and the blue circle indicates the position of the sample box within the left atrial appendage. Key: A = Anterior left ventricular wall, AMVL = Anterior mitral valve leaflets, I = Inferior left ventricular wall, LA = Left atrium, LAA = Left atrial appendage, LV = Left ventricle, PMVL = Posterior mitral valve leaflet.
Features of left atrial appendage spectral Doppler
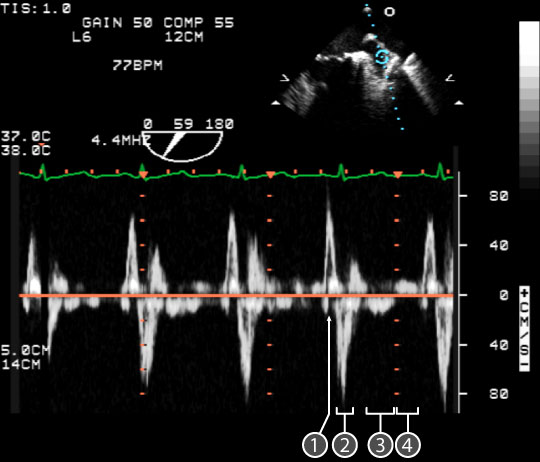
Figure 2: Spectral doppler data acquired for blood flow in the left atrial appendage (LAA). In the upper right, a two dimensional TEE image of the mid esophageal left atrial appendage view; the blue circle indicates the location of the sample volume within the LAA. In the lower half of the image, a spectral doppler trace shows the relationship between red blood cell velocity and time. The baseline is orange. Four waves are seen during sinus rhythm (see below for descriptions of waveforms 1-4).
- In a normal LAA spectral Doppler trace, four waves are seen during sinus rhythm (figure 2):
- During atrial systole, LAA contraction and emptying is seen above the baseline. Velocity is 60 ±14 cm/sec.
- During early systole, LAA filling is seen below the baseline. Velocity is 52 ± 13 cm/sec.
- Passive flow during the remainder of systole is seen as alternating small waves on both sides of the baseline.
- Early diastolic LAA emptying during LV early filling seen above the baseline. Velocity is 20 ± 11 cm/sec.
- An additional low velocity mid-diastolic wave from pulmonary venous filling maybe seen below the baseline.
Physiological variation
- Tachycardia causes ↑ LAA empting velocity
- Aging causes ↓ early LAA diastolic emptying and LAA contraction velocity
- Women have ↓ atrial contraction velocity compared to men
Pathological variation
- Atrial fibrillation
- LAA thrombus
- Mitral valve disease
- LV systolic and diastolic function