
Spectral Doppler
Page Content
Introduction
Two and 3-dimensional echocardiography forms the basis for evaluating cardiac structure and function. Spectral Doppler imaging is routinely performed for cardiac valves, vascular and other pathological lesions to assess blood flow direction and measure velocity. This confirms pathological diagnoses and quantifies lesion severity. In contrast to colour Doppler, spectral data can be quantified and used to calculate blood volumes, pressure gradients, valve areas and intracardiac pressures.
Module Aims
This module demonstrates the assessment of structures using spectral Doppler during the standard 2D examination. The normal spectral waveform for each valvular and vascular structure is accompanied by an anatomical slice of a 3D heart model displaying the spectral beam alignment. Video clips indicate the useful 2D views for optimal Doppler alignment.
Performing Spectral Doppler Echocardiography
Spectral analysis is performed using either continuous or pulsed wave Doppler. Returning echoes from moving objects undergo Fast Fourier analysis. By convention, the resulting spectral Doppler display shows velocity (y-axis) and time (x-axis). Flow towards the transducer appears above the baseline, while flow away is below the baseline.
Continuous Wave (CW) Doppler uses 2 crystals which continuously transmit and receive ultrasound (US) signals. CW Doppler produces ‘filled’ waveforms (figure 1) as all ultrasound signals along the entire length of the beam are shown. This lack of signal selectivity and depth discrimination can produce overlapping and complex waveforms (figure 2). This mode measures high blood flow velocities (> 2 m/sec) due to the unlimited pulse repetition frequency (PRF).
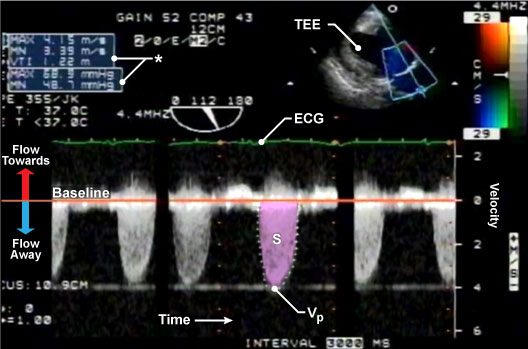
Figure 1: Continuous wave (CW) Doppler through the aortic valve.
A CW Doppler produces a filled waveform as demonstrated by the above trace through the AV. The y-axis represents velocity and the x-axis represents time. The orange baseline represents zero velocity. Blood flow towards the transducer appears above the baseline and flow away from the probe is depicted below the baseline. Measuring the peak velocity (Vp) is used to calculate the maximum pressure gradient (Pmax) while tracing the area of the systolic wave is used to calculate the mean pressure (Pmn) and VTI (*). The green ECG is used to identify which part of the cardiac cycle flow corresponds to. The upper right-hand corner demonstrates the 2D colour TG LAX view from which this spectral Doppler is measured from.
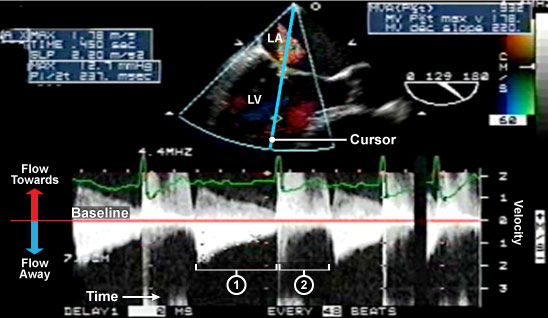
Figure 2: Continuous wave (CW) Doppler through mixed mitral valve disease.
The upper center image is a 2D colour ME LAX view with a CW Doppler measurement through the MV. CW Doppler measures all blood flow velocities along the cursor line. This is in contrast to PW Doppler which measures flow at a specific point within the heart using a sample volume box. Thus CW can measure multiple different blood flows within different cardiac chambers throughout the cardiac cycle. The lower image demonstrates mixed mitral valve disease with (1) diastolic flow through a stenotic mitral valve and (2) systolic flow secondary to mitral regurgitation. The mitral regurgitation flow is high velocity flow with absent of the waveform tips.
Pulsed Wave (PW) Doppler uses a single crystal which transmits and waits to receive and analyze the returning signal. PW Doppler produces a feathered unfilled waveform (figure 3). PW Doppler measures blood flow velocities at specific points along the ultrasound beam using a ‘sample volume’ box. However, it is limited to measuring low blood velocities (< 2 m/sec) as it is subject to signal aliasing.
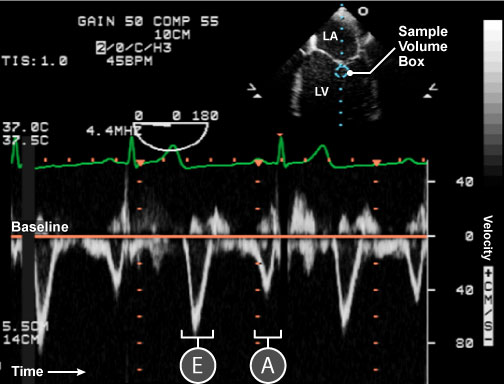
Figure 3: Pulse wave (PW) Doppler through the mitral valve.
A PW Doppler produces a feathered waveform as demonstrated by the above trace through the MV. The y-axis represents velocity and the x-axis represents time. The orange baseline represents zero velocity. Blood flow towards the transducer appears above the baseline and flow away from the probe is depicted below the baseline. Flow through the MV is depicted by 2 waveforms below the baseline, E (early diastolic) and A (atrial kick) waveforms. Tracing both waves gives the velocity time integral (VTI) and mean pressure gradient (Pmn). The upper image is a 2D ME 4ch from which this spectral Doppler is measured from.
The maximum measurable velocity is given by the Nyquist Limit (cm/sec) which equates to half of the PRF. Aliasing occurs when high velocities exceed the Nyquist limit. This is evident on the spectral display as cut-off waveforms, undifferentiated bands or as the wrap-around effect with waveforms displayed on both sides of the baseline (figure 4).
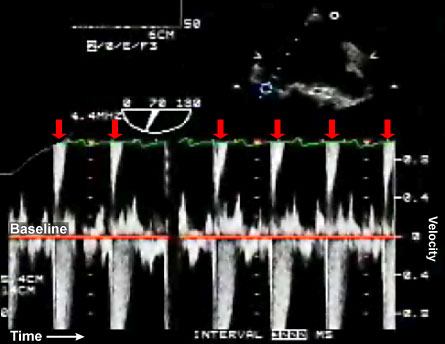
Figure 4: Signal aliasing through the mitral valve.
High velocity flow through the MV is creating signal aliasing with loss of the waveform tips. This spectral Doppler demonstrates the `wrap-around’ effect with the waveform tips appearing at the top of the trace (red arrows).
Considerations during acquisition of spectral Doppler images include:
- Select appropriate spectral mode. PW Doppler assesses all normal valves and vascular structures with the exception of the aortic valve. Evaluation of high velocity pathological lesions is performed using CW Doppler.
- Align the ultrasound beam parallel to blood flow and accurately position the sample volume box. To avoid Doppler artifact, sampling should be through the centre of the structure of interest. The PW Doppler sample volume box is placed within the centre of vascular structures and at tips for cardiac valves during the assessment of transvalvular pressure gradients.
- To minimize aliasing and optimize the spectral display adjust the velocity scale, shift the zero baseline, use CW Doppler, increase the Nyquist limit and PRF by reducing image depth and using a low frequency transducer.
- Adjust wall filters relevant to the structure of interest. Generally, wall filters are set high in order to eliminate the low frequency (velocity) signals generated by myocardial and valvular movements which contaminate the spectral baseline. Wall filters need to be reduced during the assessment of low velocity in structures, for example, mitral valve, left atrial appendage, hepatic and pulmonary veins.
- Choose appropriate sweep speeds. Commonly the sweep speed is set at 100 mm/sec. A lower sweep speed 25-50 mm/sec displays more waveforms to better illustrate pathology related to respiratory variation. A higher sweep speed displays fewer waveforms but provides greater details of individual waveforms.
- Measurements should ideally be performed at end-expiration during the assessment of the mitral valve and pulmonary veins. Measurements should be averaged over 3 cardiac cycles, particularly in the presence of atrial fibrillation.
References
- Asher CR, Klein A. Diastolic heart failure: Restrictive cardiomyopathy, constrictive pericarditis and cardiac tamponade: clinical and echocardiographic evaluation. Cardiol rev 2002;10:218-29.
- D’Cruz IA, Shala MB, Johns C. Echocardiography of the coronary sinus in adults. Clin Cardiol 2000;23:149-54.
- Feigenbaum H, Armstrong WF, Ryan T. Echocardiography. Lippincott Williams & Wilkins, 6th Edn 2005.
- Kasprzak JD, Drozdz J, Peruga JZ, Rafalska K, Krzeminska-Pakula M. Definition of flow parameters in proximal nonstenotic coronary arteries using transesophageal Doppler echocardiography. Echocardiography 2000;17:141-50.
- Mundigler GD et al. Comparison of transesophageal coronary sinus and left anterior descending coronary artery Doppler measurements for the assessment of coronary flow reserve. Clin Cardiol 1997;20:225-31.
- Nagueh SF et al. Recommendations for the evaluation of left ventricular diastolic dysfunction by Echocariography. J Am Soc Echo Feb 2009; 107-33.
- Otto CM. The practice of clinical echocardiography. Saunders, 3rd Edn 1997
- Quinones MA, Otto CM, Stoddard M et al. Recommendations for quantification of Doppler Echocardiography: A report from the Doppler Quantification task force of the nomenclature and standards committee of the American society of echocardiography. J Am Soc Echo 2002;15:167-84.
- Sidebotham D, Merry A, Leggett M. Practical perioperative tranoesophageal echocardiogrpahy. Butterworth Heinmann 2003.
- Toyota S, Amaki Y. Measurement of coronary sinus flow using transesophageal echocardiography in patients undergoing coronary artery bypass grafting. J Clin Anesth. 2000;12:270-2.